EAS 270: What You Should be able to Deduce from Weather Maps
As term progresses, further elements will be added.
Location/time
- Elevation at which the chart represents the atmosphere
- Translate Zulu time (GMT) to local (Edmonton) time
Weather features
- Recognize/identify isolines on a map (e.g. isotherms, isobars, ...)
- Recognize a low or high pressure system
- Recognize pressure (and height) troughs and ridges
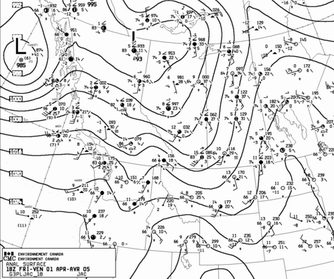
Surface Analysis
- From station report/symbols (explained in Appendix C of Aguado & Burt; or at Nav Canada) you should be able to decode:
- temperature T and dewpoint temperature Td
- fraction of sky covered (recognize qualitative degree of cover: none, less than half, half, almost overcast, overcast)
- wind direction & speed
- local sea-level-corrected pressure
- 3 hour pressure tendency
- approximate estimate of direction of motion of surface system (inferred from pressure trends)
- determine dominant pressure system (if any) for local weather
- Recognize cross-isobar flow near the surface
Other mandatory levels (850, 700, 500, 250 hPa)
- height of the constant pressure surface
- wind direction and speed aloft
- T, T-Td
- recognize troughs and ridges
- recognize thermal troughs and ridges
- recognize dominant pattern of circulation about highs and lows
- recognise zones of strong temperature advection
700 hPa level
- recognise zones of strong humidity advection
500 hPa level
- recognise stippled 534-540 dam thickness band (gray on CMC colour charts) and 510-516 dam thickness band (blue on CMC colour charts)
- recognise zones of strong thickness advection
- by comparing thickness isolines of any pair of 500 hPa charts, deduce thickness change and implied temperature change
- recognize vorticity maxima
On thermodynamic chart (e.g. Stuve diagram)
- be able to plot any given pair (p,T) at the appropriate point on the graph, or read off the numerical values (p,T) corresponding to any point
- recognize an inversion
- identify and name these families of lines: isotherms, isobars, dry adiabats, moist adiabats
- diagnose the static stability of any given layer based on comparison of the ELR in that layer with the DALR and SALR
Back to the EAS270 home page.
Link to Earth & Atmospheric Sciences home page.
Last Modified: 20 Nov. 2011