University of Alberta
The Atmosphere, EAS 372
Jan.-Apr., 2012
Introduction to using GrADS to display GEM forecast
GrADS Help
About CMC's grib2 files
The GEM forecasts are archived, with public access for a limited time. In EAS 372 we will learn how to obtain these files and display fields in GrADS.
The model outputs are stored in a format called ".grib2," and the file naming convention (for the high resolution run, i.e. 15km mesh) is:
CMC_reg_Variable_LevelType_level_ps15km_YYYYMMDDHH_Phhh.grib2
where the most frequently used cases (for us) will entail
- Variable → HGT or TMP or VVEL or SPFH (height, temperature, vertical velocity, specific humidity)
- LevelType → ISBL (isobar level)
- level → 850 or 700 or 500
- YYYYMMDDHH defines the model run, HH being the initialization time
- Phhh defines the forecast range, P000 being the zero hour prog, P012 the twelve hour, etc.
To download .grib2 files manually, or learn about what is available, start at www.weatheroffice.gc.ca/grib/index_e.html.
To this PATH, one tacks on init_time/fcstrange/filename, where init_time has two digits and fcstrange has three. The convention for filename is given above. So one might issue
http://dd.weatheroffice.gc.ca/model_gem_regional/high_resolution/grib2/12/036/CMC_reg_HGT_ISBL_850_ps15km_2012040212_P036.grib2
which will grab the 36 hr prog for the 850 hPa height field, initialized at 12Z on 2 April 2012. (One could, alternatively, download this file automatically using the wget instruction in a terminal -- as below).
For the GEM global runs, grib2 files have the naming convention:
CMC_glb_Variable_LevelType_Level_projection_YYYYMMDDHH_Phhh.grib2
These files can be sourced on the PATH http://dd.weather.gc.ca/model_gem_global/25km/grib2/lat_lon/, to which one appends init_time/fcstrange/filename, where init_time has two digits and fcstrange has three. So (for example) to obtain the 120-h forecast for the 700 hPa height field from a run initialized at 00Z on 13 March 2013 one would issue
http://dd.weather.gc.ca/model_gem_global/25km/grib2/lat_lon/00/120/CMC_glb_DEPR_ISBL_700_latlon.225x.225_2013031300_P120.grib2
Running GrADS in EAS 1-39
- We will manipulate the .grib2 files and run GrADS from a terminal: Start Menu => Cygwin => XWin Server (nb! do not choose the "Cygwin terminal"). The terminal opens, and you will be in directory c:\cygwin\home\yourccid. Useful commands in this terminal:
pwd (confirms what directory you are in)
ls -a (lists all your files)
- In the windows file manager (browser), copy the file "g2ctl" from C:\cygwin\home\administrator to C:\cygwin\bin
- Where are your .grib2 files? This depends on the setting in the browser (Firefox), which may be adjusted to save you the need to cut and paste files around: it will be most convenient to download your .grib2 files directly to c:\cygwin\home\your_ccid by making the needed adjustment in Firefox => Tools => Options. Otherwise, or if you had already downloaded the files to some place else, now move or copy them, using a file browser, to the following (temporary) destination:
c:\cygwin\home\your_ccid
(substitute your own ccid for "your_ccid").
- If "name.grib2" represents a .grib2 file, then the final two preparatory steps (to be done in your XWin Server) for each grib2 file you wish to display are:
- g2ctl name.grib2 > easiername.ctl
- gribmap -i easiername.ctl
for example,
- g2ctl CMC_reg_HGT_ISBL_850_ps15km_2012040212_P036.grib2 > height850.ctl
- gribmap -i height850.ctl
- However, if you want to plot more than one field on a single chart, you need to combine your .grib2 files, e.g. (in your XWin Server terminal)
cat file1.grib2 file2.grib2 > both.grib2
g2ctl both.grib2 > both.ctl
gribmap -i both.ctl
grads
The file names here are arbitrary; don't forget the "pipe" (>) in the cat and g2ctl commands. Now you are ready to run GrADS.
- In the XWin Server terminal, start grads (i.e. type: grads)
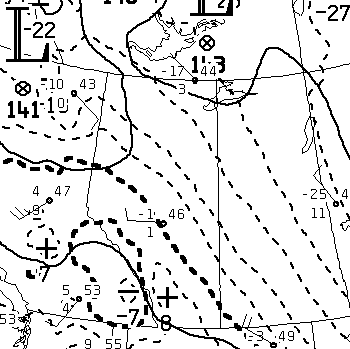
- Within grads, a typical sequence of instructions might be the following (this example produces a map of 850 hPa height and temperature covering western Canada, and saves it as a .png image):
- q ctlinfo (returns the variable names accessible to be plotted, e.g. hgt850mb)
- open hgt_tmp.ctl
- set lat 35 70
- set lon 230E 290E
- set cint 5
- set cstyle 2
- display tmp850mb
- set cint 60
- set cstyle 1
- display hgt850mb
- printim hgt_tmp_850.png png white
Another example, producing shaded contours of vertical velocity:
- open hgt_vvel.ctl
- set lat 35 70
- set lon 230E 290E
- set gxout shaded
- display vvel850mb
- set gxout contour
- set cint 60
- set cstyle 1 (1=solid, 2=long dash)
- set ccolor 0 (0=black, 1=white, 2=red)
- display hgt850mb
- draw title GEMreg 12h vld 00Z Tues 12 Mar. 2013\850 height & v.veloc.
- printim hgt_vvel_850.png png white (ensures white background)
To get a map displaying solid contours of height and dashed contours of temperature, both black on white (note: here the lat/lon are set to see a region around New Zealand):
- open hgt_tmp.ctl
- set lat -60 -30
- set lon 150E 180E
- set ccolor 0 (0=black, 1=white, 2=red)
- set cstyle 1 (1=solid, 2=long dash)
- set cint 60
- d hgt850mb
- set cstyle 2
- set cint 5
- d tmp850mb
- draw title ...
- printim hgt_tmp...png png white (ensures white background)
Back to the EAS 372 home page.
Back to the Earth & Atmospheric Sciences home page.
Last Modified: 20 Mar., 2013